Before we jump to the core Kanban metrics, I would like to touch upon the core principles of Kanban development. They are:
-
Visualize the workflow
-
Limit WIP
-
Continuous measurement and improvement of the life cycle
We have covered the first two principles in a previous blog post, Getting Started with a Kanban Project on JIRA. We will cover the third principle in this post: how to measure the performance of a Kanban project and how to improve upon it.
Kanban Metrics to Track
Let’s look at the Kanban flow-chart from the perspective of a treasure hunt.
The game has which several teams that are competing to find the treasure by solving five puzzles at various stages, and procuring the treasure at the end of the last stage. All the teams will begin at the same time and will be given the same puzzle to solve. The team that reaches the treasure in the shortest time will be declared the winner. The shortest possible time can only be achieved when a team completes each of the five puzzles faster than the other teams. In order to gain lead time over the other teams, each team has to solve each puzzle faster than the others.
Therefore,
Best Lead Time = Min(Cycle Time at Stage 1) + Min(Cycle Time at Stage 2) + Min(Cycle Time at Stage 3) + Min(Cycle Time at Stage 4) + Min(Cycle Time at Stage 5)
The below-mentioned definition will explain the Lead Time and Cycle Time in a better way for a Kanban project:
-
Lead time: This tells you how much time it will take to finish the task after it is received from the customer.
-
Cycle time: This is the time required to complete a certain task after the developer starts work on it.
If we relate the above example to any Kanban project, the development team will have to focus on achieving a minimum lead time by continuously focusing on reducing the cycle time for each of the work in progress processes (Development, Theming, Testing, UAT).
The Scrum Master of the project will then have to keep a regular check on these two primary metrics and share it with the development team so as to analyze the ongoing performance of the team. It is always advisable for the team to log performance on these Kanban metrics over a period of time for comparative analysis. The team will then be able to identify bottlenecks/obstacles easily and suggest performance improvement areas.
Reporting for Kanban teams
There are two common reports that Kanban teams should use:
- Control charts
- Cumulative flow diagrams
Control Charts
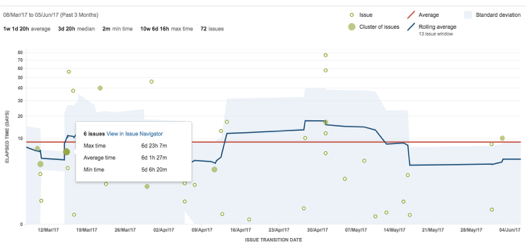
A control chart report helps the team to keep track of the cycle time for each of the issues plus the rolling average (lead time) for the set of issues in the development process. Here’s a control chart for one of our projects:

The red line in the chart indicates the Average Cycle Time for a given set of issues in the development process over a specific period of time. The blue line shows the rolling average cycle time. The rolling average is issue-based, not time-based. For every issue shown on the chart, the rolling average (at that point in time) is calculated by taking the issue itself, X issues before the issue and X issues after the issue, and then averaging their cycle times. Twenty percent of the total issues displayed (always an odd number and a minimum of 5 issues) is used in the calculation.
For example, in the screenshot above, at the point of time where an issue (green dot) is shown, the rolling average is calculated as follows:
-
Take the issue plus 6 issues before and 6 issues after (6 issues total).
-
Average the cycle times for the 13 issues.
-
Map the blue line to the calculated average.
-
If the Timeframe is reduced to 'Past two weeks', the number of issues used would reduce, as there are fewer total issues available to use for the calculations.
Tips for the Scrum Master
- The team's goal is to focus on reducing the time an issue takes to move through the entire process. Seeing the average cycle time drop in the control chart is an indicator of success.
- The closer the rolling average line is to the average line, the greater the control the team has over the process. And greater the precision in releasing tasks over a defined period of time.
- Spot the Outliers: As the name suggests, outliers are issues that lie outside the standard range of resolution time. These are also the issues that can be easily spotted on the control chart as they are the ones that lie in the white area. The Scrum Master should notify the team of these outliers and find a way to resolve these issues as these impact the Average Rolling Time in the control chart.
Cumulative Flow Diagram
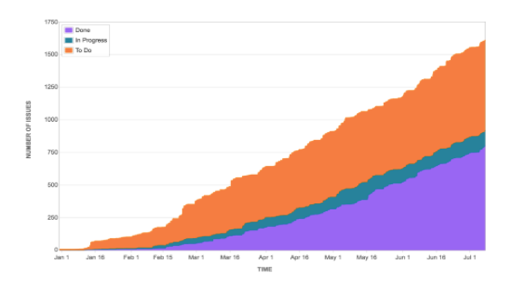
The second type of report that a team can use is the cumulative flow diagram, which shows the number of issues in each state. A team can easily spot blockages by seeing the number of issues increasing in any given state. Issues in intermediate states such as "In Progress" are not yet shipped to customers, and a blockage in these states can increase the likelihood of conflicts while delivering tasks to production.
Here’s a sample cumulative flow diagram:

SMs must keep a track of this flow diagram to understand the Kanban progress. This diagram can give various insights into the current state of the project. Let’s try to understand this with the help of another cumulative diagram shown below:
There are five stages in the above cumulative flow diagram: In Dev, In theming, For Code Review, In QA and UAT. By looking at the graph, an SM can see that the number of issues in the UAT stage are on the rise, and sufficient UAT isn’t happening in the development process. Thus, it requires for an action item to nudge the UAT contact person to speed up the UAT process. The primary objective in a Kanban project is to keep the flow ticking by spotting and removing such blockages.
The Kanban Board has only two reports - control charts and cumulative flow diagram - as compared to the Scrum Board, but these reports give sufficient insights for an SM to keep a project on track by monitoring performance indices like Cycle Time, Lead Time and Average Cycle Time.
So there you have it, two well-defined ways to monitor and report the progress of a Kanban project. Of course, based on your particular project requirements, and the level of visibility you want, you might wish to customize these reporting formats.
Are there any other Kanban metrics that you monitor, or methods that your team uses to measure project progress? Let me know in the comments below.
Our Services
Customer Experience Management
- Content Management
- Marketing Automation
- Mobile Application Development
- Drupal Support and Maintanence
Enterprise Modernization, Platforms & Cloud
- Modernization Strategy
- API Management & Developer Portals
- Hybrid Cloud & Cloud Native Platforms
- Site Reliability Engineering


