Application performance plays a critical role in delivering a top-notch customer experience. That’s where TedBoard comes in. It is a self-hosted solution that helps in creating cloud infrastructure on demand for running JMeter scripts in near real-life scenarios.
TedBoard enables the QA teams to manage and provision test infrastructure independently, without relying on devops engineers. By eliminating the bottleneck of infrastructure provisioning, QA teams can conduct multiple performance tests on the application at different internet speeds consistently, ensuring good application performance.

Self-hosted solution provides complete control of your data and allows you to schedule recurring test runs

Centralized management of testing environment with standard server configurations ensure performance consistency across all releases

Built with open source, which means no license cost. Also, save on provisioning delays and stale instances, which consumes resources

Access all types of reports from a center allocation through interactive dashboards and perform data analysis

Identify and diagnose issues quickly by observing real-time test data and filtering results through interactive graphs.

Control and scale the number of servers provisioned for your testing needs through a simple UI

Schedule performance scripts to run automatically at set intervals and outside of peak business hours.

Analyze application performance trends across different releases to identify potential performance issues and make proactive decisions.

Get email notifications about the test status (triggered / passed / failed / completed). These are vital, especially when dealing with a large

Assign permissions to users based on their roles to control test execution, scheduling, and report access.

Streamline testing process by hosting multiple teams on a single platform and running their tests independently and securely.

Extend Ted Board capabilities by leveraging inbuilt APIs to implement security, accessibility and build automation dashboards
%20(1).webp)
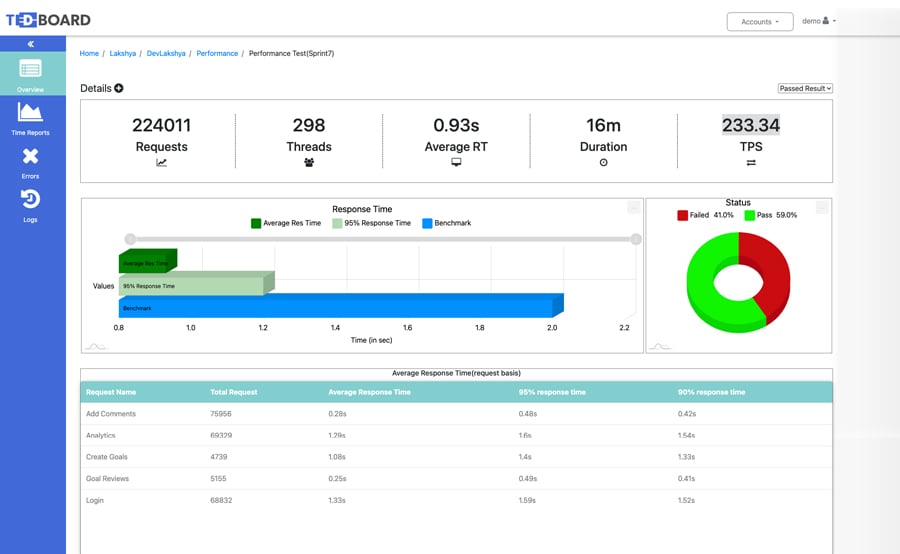
To evaluate application performance, get a consolidated dashboard of vital statistics from the test run and compare them with the established performance benchmark. Analyze errors and trends to promptly identify issues and take preemptive measures.
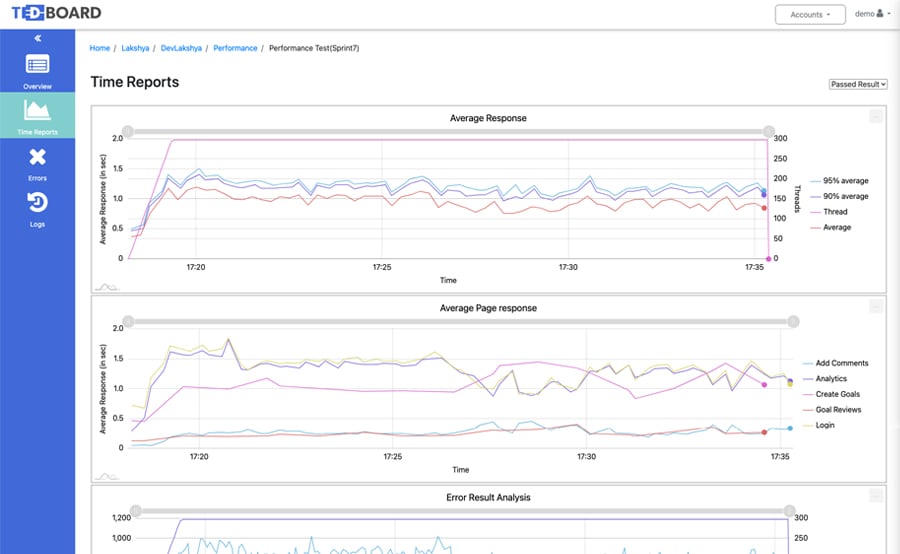
Use interactive graphs to drill down and analyze the performance of individual pages at different visitor load sizes and error levels.
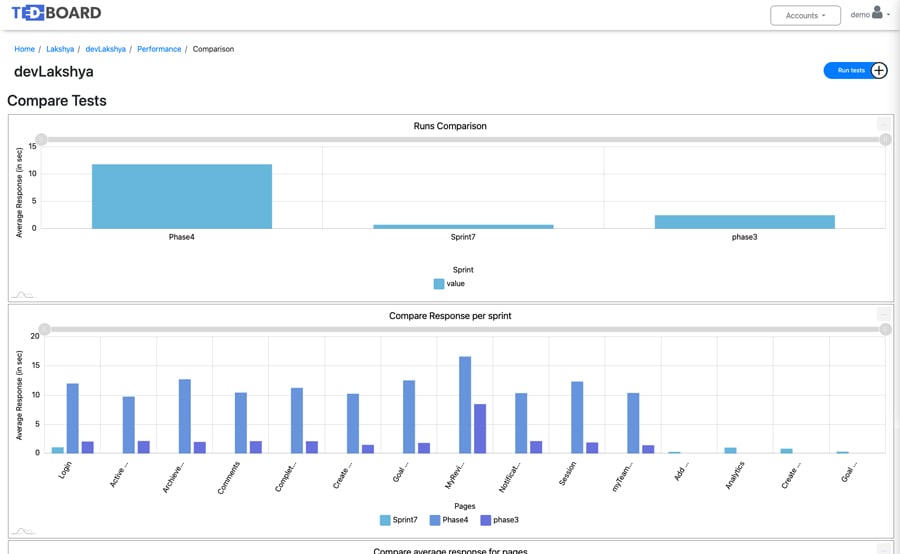
Compare the performance of the application across multiple sprints or releases and identify trends over time.
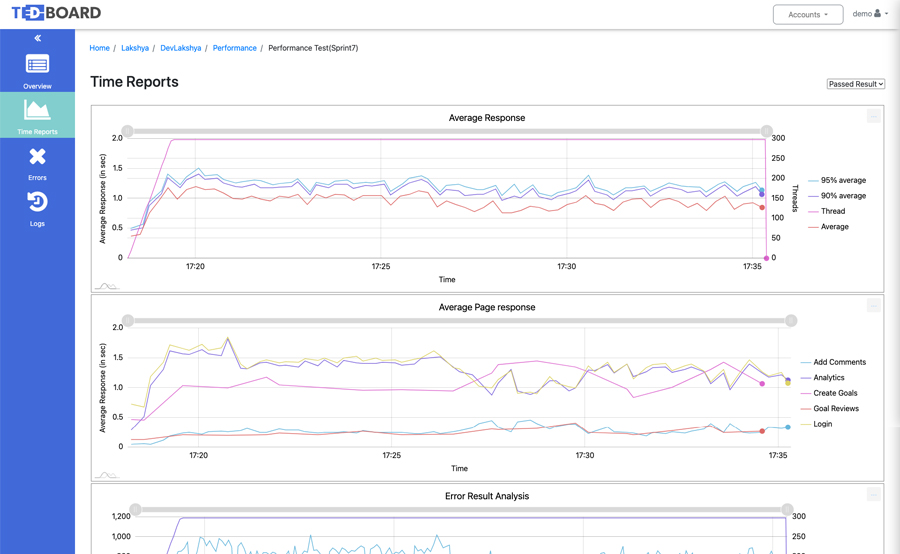
Collect error details that arise under different loads to prioritize and define failover needs.
Subscribe to our newsletter